The AWS Serverless Application Model (SAM) CLI is a developer tool that makes it easier to develop and deploy serverless applications on the AWS cloud. It comes in handy when starting a project from scratch since it contains a wide selection of templates in multiple programming languages, which can be used as a starting point. This saves a lot of initial setup time required to write the boilerplate code for an application.
The Breakpoint Problem
There is an issue with the Typescript templates generated using SAM CLI. Due to a bug in the latest version of the CLI, as of April 2024, there is a problem when building with the sourceMaps option enabled. Specifically, the sourcemap points to an incorrect location in the filesystem. As a result, debugger breakpoints do not pause at the actual Typescript source code.
In this short write-up, let’s see how we could circumvent this limitation and use the VSCode debugger for TypeScript projects managed using SAM CLI.
Create a TypeScript Template
Typescript is one of the languages for which we could generate a starter template with SAM using the following command:
sam init --runtime <your_node_version> For this demo, let’s use node version 20:
Sam init --runtime nodejs20.x And then let’s proceed to create a “Hello World” boilerplate:
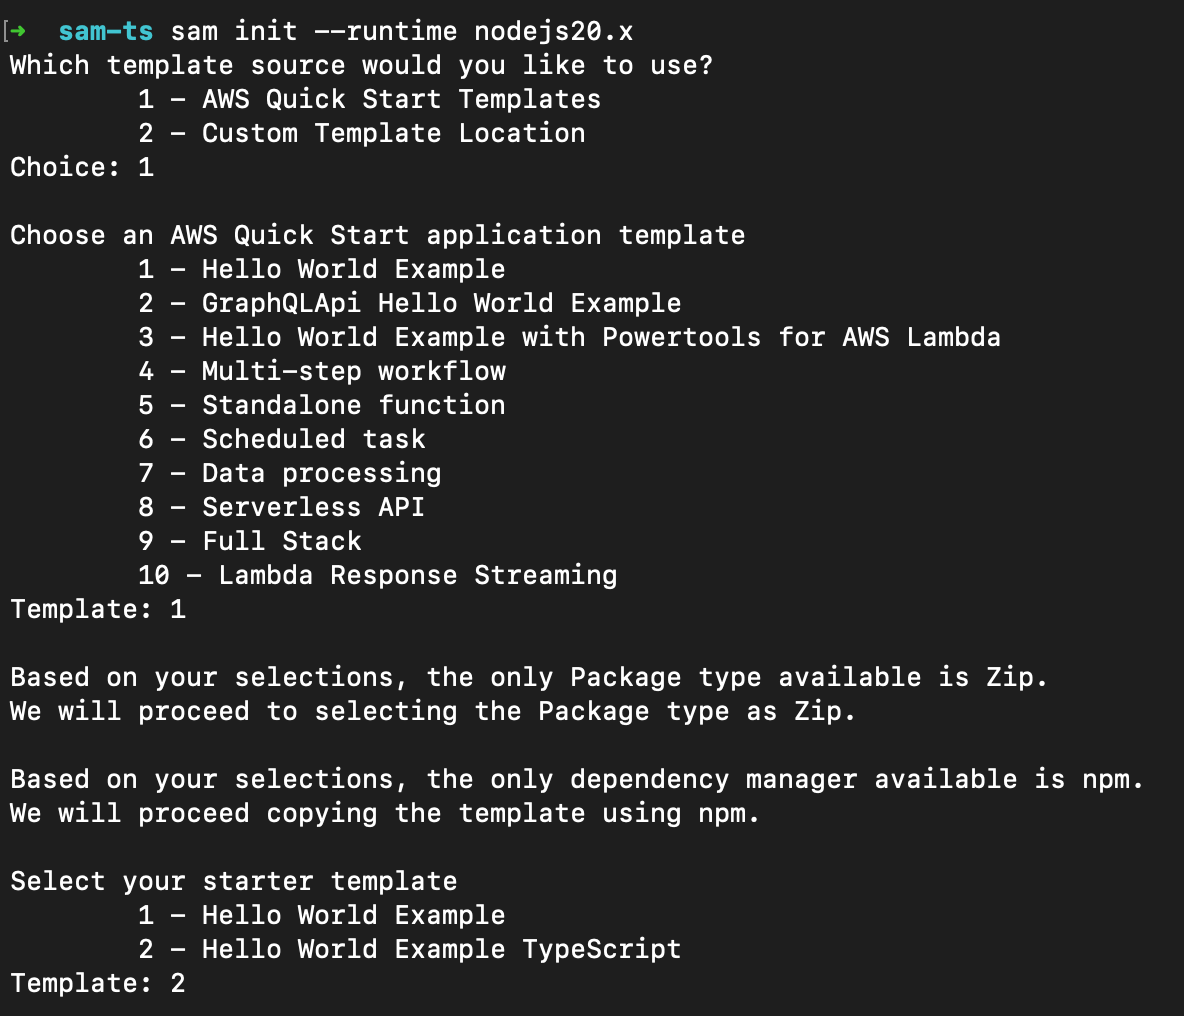
The above would generate TypeScript boilerplate code along with an event json file that would mock an API gateway request.
Build The Project
To ensure that we also generate the sourcemap file, let’s verify that the “Sourcemap” field is set to true in the “template.yaml” file, present in the project’s root directory:
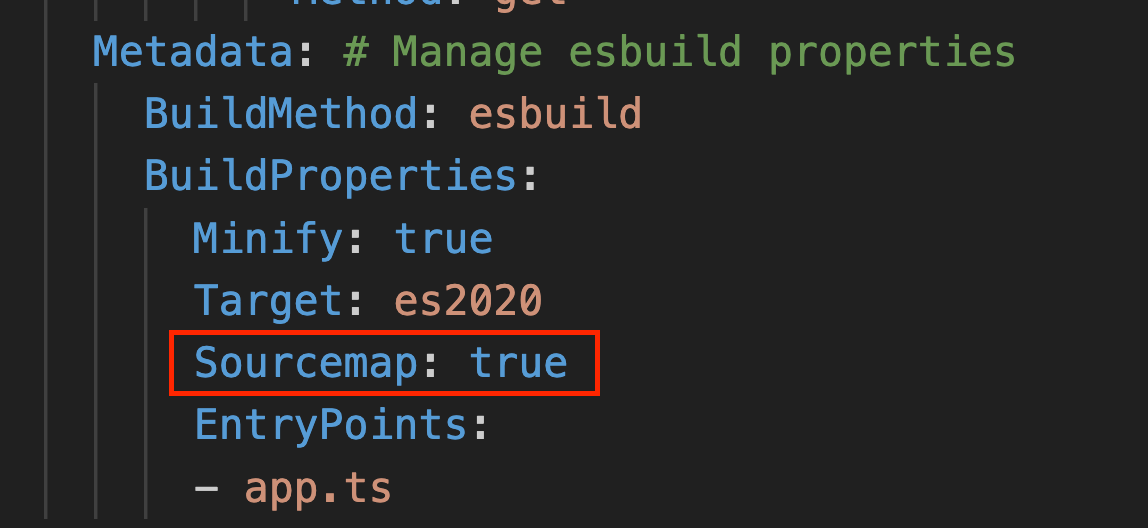
Now let’s build the project using the following command:
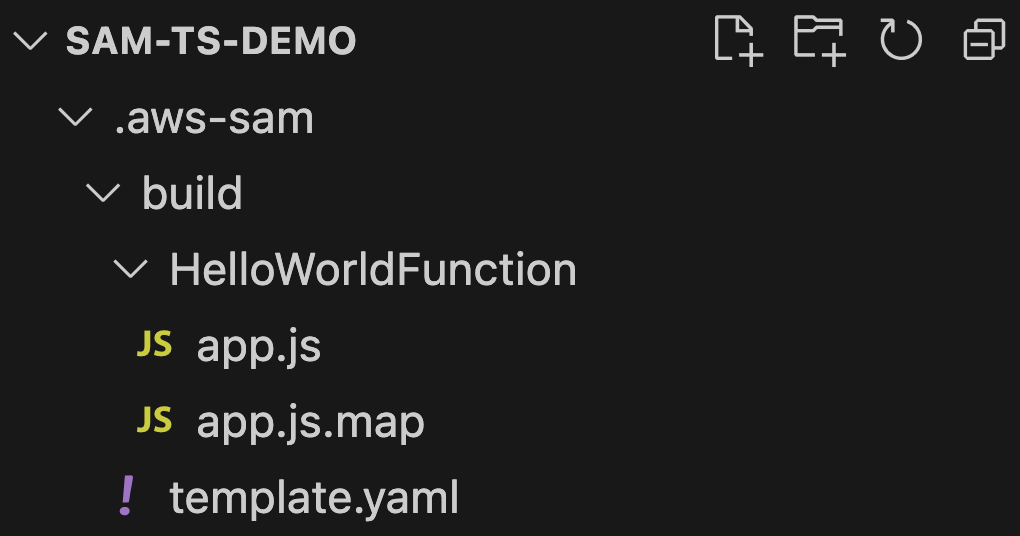
sam buildThis would build our project and place the build artifacts into the default location “.aws-sam/build/”
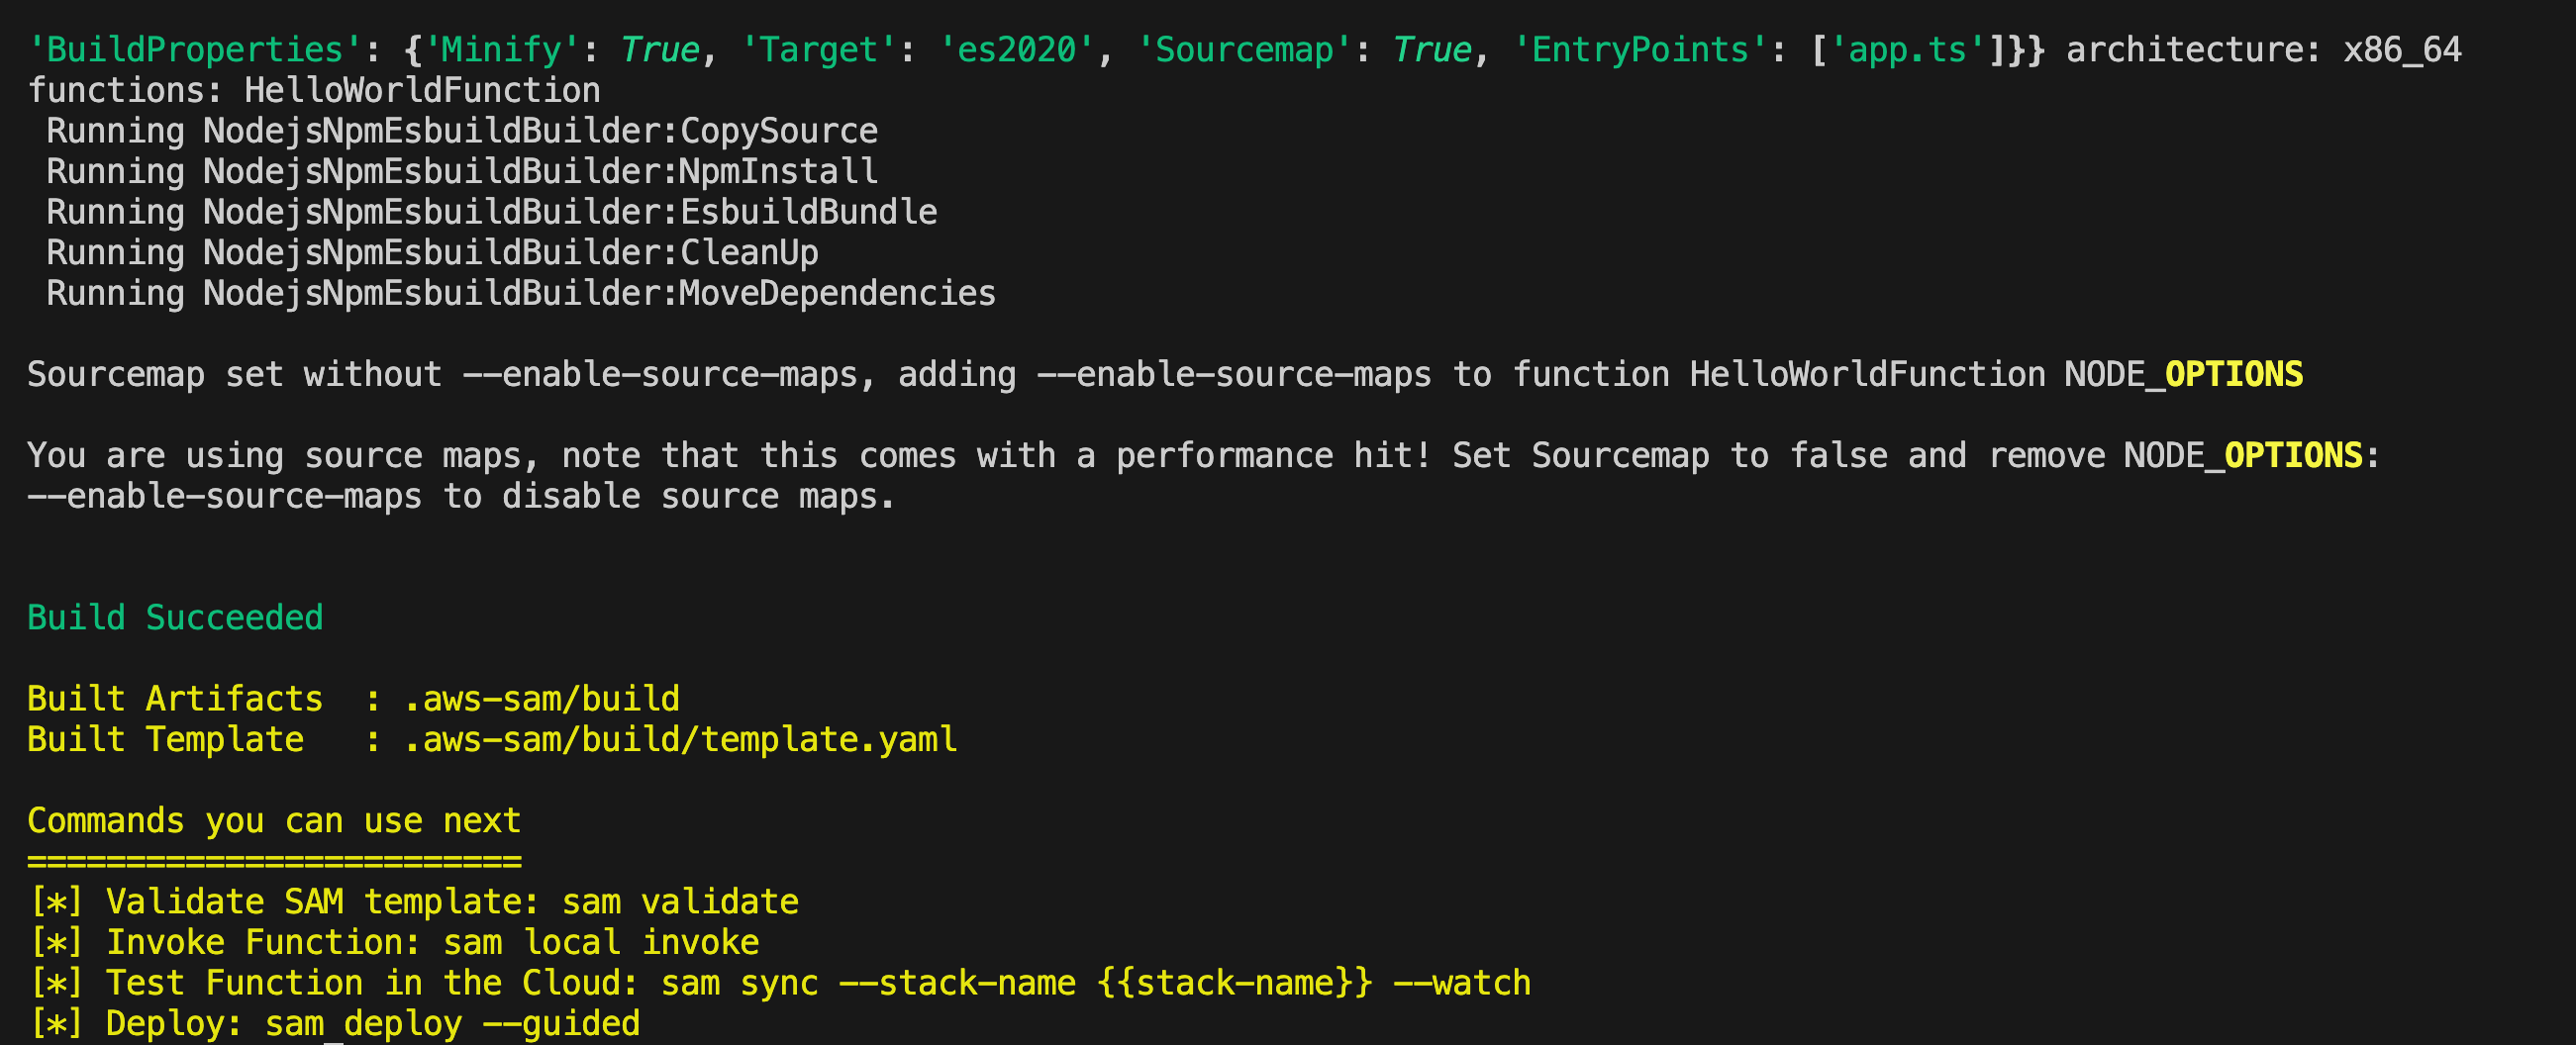
This would result in the creation of the following directory tree:
Setting Up The Debugger
Launch JSON Configuration
In VSCode, we can create debugger profiles by authoring a “launch.json” file. This file has to be placed within the “.vscode” directory, which in turn should be at the root of the project.
Let’s create the debugger profile in the launch.json as follows:
{ "configurations": [ { "name": "SAM-TS", "type": "aws-sam", "request": "direct-invoke", "invokeTarget": { "target": "code", "lambdaHandler": "app.lambdaHandler", "projectRoot": "${workspaceFolder}/hello-world/debug", }, "lambda": { "runtime": "nodejs20.x", "environmentVariables": {}, "payload": { "path": "${workspaceFolder}/events/event.json" } }, "sam": { "containerBuild": false, "skipNewImageCheck": false }, "api": { "httpMethod": "post", "path": "/", } } ] } We will also need to install the AWS Toolkit VSCode Extension in order to run the debugger with the custom type of “aws-sam”.
Build Directly With ESBuild for Debugging
As seen in the template.yaml file, SAM CLI uses “esbuild” to build the TypeScript project.

But, If we use the source map that gets generated by the “sam build” command, our breakpoints set in the TypeScript source code will not be hit. This is because of the wrong source path mapping generated by the sam build process:

This path doesn’t exist, hence debugger can’t map to the source TypeScript file from the compiled and built JavaScript file.
To bypass this issue, let’s create the debug build directly using the “esbuild” tool as follows and add it as a script to the project’s “package.json” file:
"build:debug": "esbuild --bundle app.ts --outfile=debug/app.js --sourcemap --platform=node --target=node20 --minify"For our debugger to work as expected we need to have a build artifact in the debug folder. That is, we should run the “npm run build:debug” command before running the debug command on VSCode.
We could do this step manually or configure our “tasks.json” file to make the build step happen automatically before attaching the debugger whenever we run the debug command on VSCode.
Configure the preLaunchTask in VSCode
Let’s create a file named “tasks.json” inside the “.vscode” directory and define a task to invoke our debug build script:
{ "version": "2.0.0", "tasks": [ { "label": "buildProject", "type": "npm", "script": "build:debug", "path": "hello-world", } ] } We can now reference this task in our “launch.json” configuration file as follows:
{ "configurations": [ { "preLaunchTask": "buildProject", "name": "SAM-TS", "type": "aws-sam", "request": "direct-invoke", … keep the rest of the config from the previous section } ] } Now, when we run the debugger command on VSCode, a new build will be created in the “debug” directory and our source path would be mapped properly in the generated sourcemap file:

Conclusion
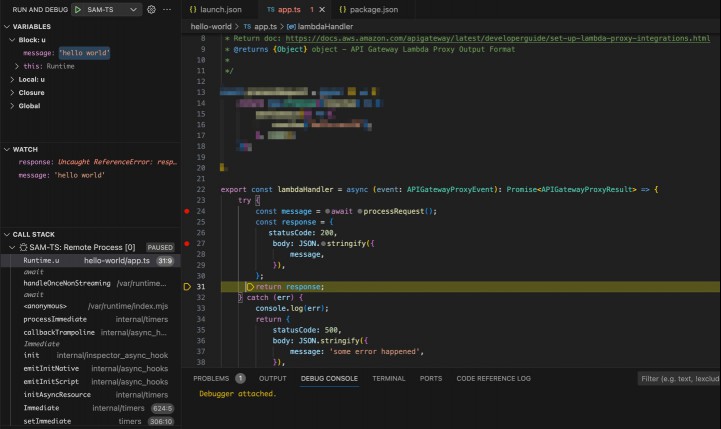
With these configurations and settings, we now have our debugger setup properly by working around the issue created by SAM CLI in its sourcemap generation process. We’ll not only be able to pause at breakpoints in our Typescript source file but also use all the other features of the VSCode debugger such as variable watching and call stack monitoring as we would do with any other codebase.
A caveat with this approach is that every time we run the debug command, the build will also need to be run (either automatically, as in our setup or manually if you’d prefer it that way).
Thank you for reading the Babbel Magazine!
If you’d like to learn more about our engineering culture, please check out Babbel Bytes.
Click below if you’d like to become an engineer at Babbel!

Comment